Tuesday, August 23, 2011

Group Project Profile: Ragweed in a Changing Climate

by Linn Jennings, Laura Hancock, and Samuel Safran

Ambrosia artemisiifolia, better known as common ragweed, is a leading cause of hay fever allergies. It grows in disturbed areas, like roadsides and abandoned fields. Increased atmospheric CO2 has been shown to increase the pollen production and growth of ragweed. Thus, with predicted changes in land use and climate, pollen production of common ragweed is likely to increase. Our team carried out three experiments – a presence/absence study, a demographic study, and greenhouse experiment – to collect data that will be used to develop maps of allergy risk under both current and future environmental conditions.

Greenhouse Experiment - Laura

Hoop houses were used to create three CO2 treatments– 400 ppm, 600 ppm, and 800 ppm. These levels correspond to current carbon dioxide concentrations and concentrations predicted to occur over the next 100 years. Growth, morphology, and reproduction characteristics of 1248 individuals from 24 total populations in New York, Massachusetts, and Vermont were analyzed to show how, and if, these characteristics differed between treatments and between ecotypes from the different states.  We found that there were distinct qualities to these three different ecotypes and that they reacted to the CO2 treatments differently. Specifically the Vermont populations, which are from cooler, less urbanized environments, had distinct characteristics when compared to the more similar New York and Massachusetts populations.

Ragweed Demography - Linn

Our research focuses on the current phenology and life cycle of A. artemisiifolia in 24 populations located along rural to urban and warm to cool gradients from Boston to the Berkshires in Massachusetts.


We collected data on growth rates and flowering for each population. Other data, such as percent cover in each plot (3 to 5 plots per population) and land cover, were collected to evaluate the impact of surrounding vegetation and fine scale land cover on plant phenology. The data demonstrate a trend of taller plants in the cooler sites, less urbanized sites, which might indicate a plant selection for shorter plants in regions that are mown more frequently. Further, the most important predictor variables found in the presence-absence survey were not significant predictors of plant size and flowering. When modeling future allergy hotspots, different predictor variables will be needed when modeling the presence and absence of ragweed and when modeling the plant size and flowering time of ragweed.

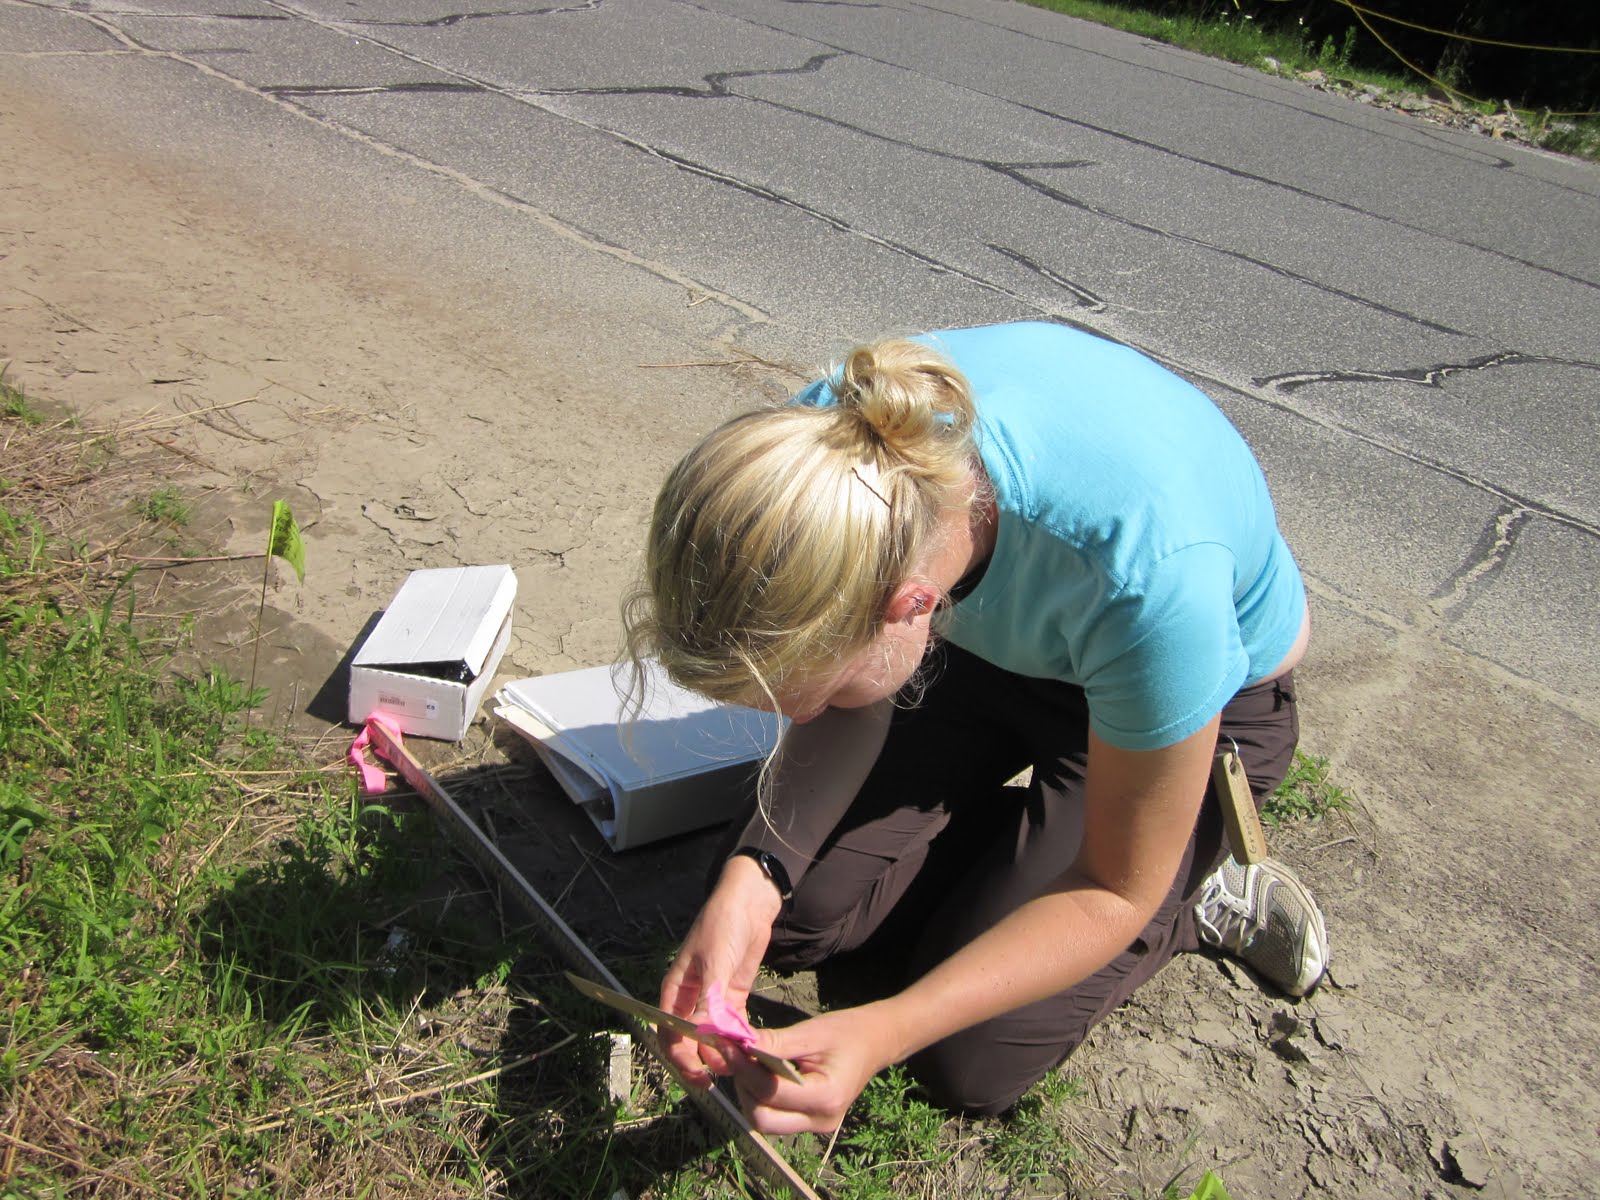
I set up 24 sites across the state with the help of my group partners, Sam and Laura, and with the help of my mentor, Dr. Sydne Record. Each week, starting after 4-5 weeks of building and working in the greenhouses at Harvard Forest, I drove to each of the sites to collect growth, abundance and flowering data. I spent about 3-4 days a week in the field, and I would enter and analyze my data on Thursdays and Fridays. I spent lots of time out on the road, but I had a great time traveling around Massachusetts.


Presence-Absence Survey - Sam
I set off (GPS in hand) to Vermont, New York, and Massachusetts in search of the pesky plant. My mission: to sample hundreds of randomly generated points for ragweed abundance and local land cover characteristics. Being random, the points took me to all sorts of interesting locations. Trudging through freshly manured corn fields, tiptoeing across forested swamps, forging mountain rivers, and pacing back and forth in front of Brooklyn store-fronts all afforded me much time to ponder the sorts of habitats and climates that ragweed favors. Thankfully, once all the data were collected, I also had the power of dynamic geographic and statistical tools to help answer this very question. 

By pulling bio-climatic data about each point from WorldClim layers, demography data from Census layers, and other information from my own layers (distance to nearest road, slope, etc.), with GIS, I was able to build a large data set for the ~200 points sampled to date. To analyze these data, I ran a bagged classification and regression tree (CART) analysis to identify the most important variables for predicting ragweed presence/absence. The analysis indicates strong positive correlations between observed edge habitat and ragweed presence as well as between observed forest habitat and its absence.  The strongest predictor of ragweed presence was found to be distance to nearest road, a variable derived remotely with GIS. Some clear climate effects—including average precipitation and temperature during the growing season—were also shown to be highly relevant predictors of ragweed presence.  

In the end, this fancy regression gives us preliminary framework for modeling ragweed’s distribution across the whole New England landscape. By holding a portion of the data I collected out of the initial analysis, I was able to run it through the model after the classification tree was developed.  This test tells us our model correctly predicts ragweed presence/absence more than 70% of the time.  Exciting stuff! This dataset will be used to test the accuracy of free and simple methods for identifying ragweed habitat, to model its distribution under current climate conditions, and to map regional allergy hotspots under future climate scenarios at a scale relevant to an individual’s exposure to pollen.

REU Skydiving!

By Laura Hancock

After all the work and research is done, we definitely know how to have some fun! The last weekend of the program, three fellow REU students--Lindsay Day, Alanna Yazzie, Keke Mitchel, and I decided to do something extremely exciting and go skydiving! We've all wanted to try it, so to me it seemed like the perfect way to end the summer.


About 20 minutes from Harvard Forest, in Orange, Massachusetts, is a top-notch skydiving facility, Jumptown. All of four of us decided to jump tandem, though you could go through a day of training and jump on your own. We exited the plane at 13,500 ft and experienced a minute of freefall and 5 minutes of cruising (once the parachute has been opened). My instructor let me 'steer' and pointed out all sorts of amazing sites while in the air, like the Quabbin Reservoir. I loved it so much I looked into places near where I live to go skydiving, so I can go for my license.

Project Profile: Microbes in a Warmer World


By Tara and Kelden

A major area of research here at Harvard Forest focuses on understanding the ecological changes within the forest due to a rapidly warming climate. These climate conditions are replicated at the forest using several experimentally warmed plots that are heated by resistance cables placed beneath the soil surface. In collaboration with the Marine Biological Labs (MBL), we attempted to understand microbial diversity and function within these manipulated plots, in order to investigate the roles of these microbes in the global carbon cycle in response to warming. 

This study was motivated by prior research that showed initial pulses of soil respiration in the warmed soil plot in Barre Woods.  The respiration flux eventually decreased to control levels within a few years only to then experience a subsequent pulse. In combination with subsequent studies, it is believed that this shift is the result of a shift in microbial community composition, more specifically, away from communities able to break down the easily accessible labile soil carbon and towards communities that are better able to break down tougher recalcitrant carbon sources. Essentially, the easy carbon was used up upon initial heating, and microbes had to adapt to decomposing more difficult carbon sources.  These findings will provide important information which will allow us to better understand this potential feedback system of the carbon cycle.

In a separate project, the microbial function of the community was quantified based on enzyme activity, with specific focus on the production of CO2. Although this is an effective way to understand carbon cycling processes that may be occurring in soil communities, it does not delve deep into the world of microbes that make up a significant component of the soils and are responsible for these processes. Therefore, our overall goal was to understand microbial species diversity and function using a genomics approach. This study utilized genetic sequence data to investigate the microbes that are present within the soil. The Barre Woods experiment is an ongoing process, and therefore, we were unable to conduct any analysis this summer on soil samples collected from that warming plot. However, two unpublished data sets, derived from soil samples collected at Harvard Forest, were provided to us by the National Ecological Observatory Network (NEON) and the Bill Landesman Research Group. We utilized these data sets to develop genomic and computational methods that will be used in future analyses of the data collected from the Barre Woods plots.

Our analysis began by understanding the genes present within the NEON data set, which was derived from a soil sample collected on Prospect Hill. DNA sequences in the data set were compared to known sequences present within online databases, such as NCBI. The resulting alignments provide a gene role and function within the cell based on the matching sequence. We can use the resulting matches to identify proteins that are involved in important ecological processes such as the nitrogen and carbon cycles. At the same time, we specifically searched for enzymes that are able to break down various forms of carbon.
A second approach involved studying microbial diversity, which was done with a similar DNA dataset. This data was processed through a program called QIIME, which integrates a series of scripts that call upon various programs to provide a taxonomic survey of the microbes within the sample based on sequence similarities.

The results from diversity analyses of our two datasets revealed that Proteobacteria and Acidobacteria were the dominant phyla present in the soil. This suggests a high prevalence of microbes that are involved in the nitrogen cycle, the carbon cycle, chemical decomposition, and biomass degradation. The gene analysis of the NEON data revealed that a majority of genes are associated with carbohydrate break down and energy production.

The results provided us with a glimpse into the microbial diversity here at the Harvard Forest. The methods developed using the two provided datasets will be replicated in our analysis of Barre Woods to understand the microbes present in the warming experiment. We expect to see unique microbes that are able to break down a broad range of carbon sources, and adapt to growing in warmer conditions. At the same time, we predict to see an increased prevalence of proteins involved in biomass degradation. This will ultimately be the focus of our research over the course of the following year.

Stay tuned for more results!

Project Profile: Water Transport in Trees

By Alena Tofte

Multitudes of tightly packed rings in an old, sturdy tree hide a secret – not only do they elucidate to a discerning viewer a historical record of how much the tree grew each year for the course of its life, but these rings also contain the remnants of its once-functional woody vascular tissue, the xylem. Xylem once threaded thin streams of water and vital nutrients throughout the growing tree’s roots, trunk and crown. Water transport in trees is a process ruled by a multitude of factors, including the porosity of the wood, the size of the vessels which comprise the vasculature, the species’ inherent differential ability to tolerate variation in climate and water availability, and the surrounding changing environmental and climatic conditions. Diurnal variation in the amount of water available to a tree, due to soil moisture and atmospheric conditions, can induce cavitation, or the formation of gaseous embolisms within xylem conduits. These bubbles decrease the overall efficiency of water transport, and are previously thought to permanently eliminate functionality of those xylem vessels. However, some evidence has implied that cavitated conduits refill on a diurnal cycle, by possibly pressurizing the embolisms on a localized scale and forcing the gaseous bubbles in to solution and reestablishing continuity within the xylem’s transpirational stream. To address the ongoing debate surrounding refilling and investigate a little about what is going on within the trunk of a tree, we measured the water transport efficiency, or conductivity, of white ash, red maple, and paper birch stems on a diurnal cycle. We used Bucky, the cherry picker, at our site to cut canopy samples in the afternoon and again the following morning.  There’s nothing quite like the smell of diesel exhaust at 6:00 a.m.! Our measurements show preliminary evidence of refilling in ash, but not in maple or birch. Further data collection of may corroborate these conclusions. This summer, I’ve gained a better understanding of how species-specific physiological capacities like diurnal embolism and refilling may determine rates of photosynthesis and carbon sequestration, tolerance of water stress, and associated geographic distribution  of different trees with respect to their surrounding water availability.

Project Profile: Urban Ecology

By Ashley Golphin 

Whereas most of the 2011 Harvard Forest REU group conducted research in rural forested areas, my research partner Stephan Bradley and I braved the streets of inner-city Boston to expand our understanding of how urban ecosystems function with regards to urban greening. 

Urban greening is the expansion and conservation of vegetated areas in cities through local stewardship practices. For this study we choose 7 urban green sites (community gardens and pocket parks) and paired them with 7 nearby non-green sites (abandoned lots) to explore how human use patterns, along with related measures of biodiversity (i.e. macroinvertebrate and avian population) and temperature differ between urban green and non-green space. We found that there was a statistically significant difference in human behavior at between the sites with people being far more engaged with the green sites than the non-green sites. Data analysis for biodiversity measures are ongoing.

Project Profile: Sampling the Lyford Grid

By Kate Eisen and Collette Yee

A permanent plot study provides an amazing opportunity for ecological research because it allows scientists to observe changes over ecological time. While many studies take place over a few field seasons at most because of funding or other limitations, permanent plot studies allow scientists to ask questions that only be answered over years or decades by providing a larger window into the dynamics of a site or population over time. For this reason, permanent plot studies are also essential to studying organisms like trees that grow slowly and often live for a long time.
  
At 42 years old, the Lyford Grid is Harvard Forest’s oldest running permanent plot study. Soil scientist Walter Lyford, who lived in a house a short walk away, established the site in 1969. Lyford gridded the 2.9 hectare continuous plot into 32 100x100 foot squares, and mapped in each individual tree onto hand-drawn maps. Because Lyford was a soil scientist and had a broad-range of ecological interests, he not only censused all living and dead trees but also recorded the position of rocks and streams, and marked the spatial distribution of soil types in the plot. The detailed maps he created provided the basis for later censuses of the Lyford Grid.

All the living and dead trees greater than 5 cm diameter at breast height (DBH, 1.3m) were recensused by teams of Harvard Forest researchers over the period from 1987-1992, and again in 2001. Additionally, an REU student in 2001 digitized all of Lyford’s maps, preserving the data in the form of ARCView maps of each square in the grid.

The Harvard Forest plans to census the Lyford Grid every ten years, so we were lucky enough to get to participate in its recensusing this year. In the field, we measured nearly 4,000 individuals. Within each 100x100 ft block, we tried to relocate each individual recorded on the maps and datasheets from 2001. When trees have completely decomposed, they are recorded as gone, but more often, we could relocate them in the field.

For each living individual, we measured its DBH, condition (living, dead, etc.) and canopy class (how much of the canopy the tree occupies). For dead trees, we measured the diameter when possible, the length and direction of any remaining piece of the downed tree, and its decay class. During these long days in the field, we became able to confidently identify numerous tree species, effectively combat bugs, and fashionable carry our field gear around using a handy tool belt.

The fieldwork and data entry occupied the first half of our summer, but since finishing this part of the project, we’ve had the luxury of working primarily indoors, analyzing the data. Because our dataset includes over 6,000 individual trees and many variables, we were able to tailor our individual projects to our interests.

Kate
My individual project uses the Lyford Grid data to track changes in species composition and their impact on aboveground biomass of the entire forest over time. Many previous studies have suggested that northeastern forests serve as a significant regional carbon sink because trees absorb more CO2 than the ecosystem emits into the atmosphere. However, these studies haven’t investigated how changes in the forest stand might impact the aboveground biomass, and I think that the types and frequencies of trees in the forest should have an impact on the overall carbon sequestration. My results show that biomass in the Lyford Grid is increasing almost perfectly linearly with time, which suggests age is not limiting the forest’s growth. Red oak (Quercus rubra) comprises the majority of the forest’s total biomass at each census. Therefore, in the future, I hypothesize that stand age, species composition, and disturbance patterns will all impact the aboveground biomass of the Lyford Grid and similar temeperate, northeastern forests. I really loved everything about working on this project, from the days in the field to the chance to work really closely with my mentor and other researchers in the Harvard Forest community!

Collette
I focused my study on understanding the growth patterns of red maples across environmental gradients. I found red maples to be a particularly interesting to study, for its characteristics of being able to grow on a wide variety of conditions sets it apart from other species. With the Lyford Grid having 42 years of data and detailed information about site history, I wanted to utilize as much of that information as possible. I compared growth rates to soil moisture, site disturbance, size of tree, and competition. The field work component was the most interesting part of the summer. I loved being able to walk a short distance from Shaler Hall to the plot. The part that consisted of checking though and organizing data was nowhere near as exciting as exploring a type of forest that was entirely new to me. I’m leaving this summer with more than I imagined. I know that the learning experience, great friends and unforgettable moments will all be reminisced upon when I think about the Harvard Forest and my first time to the East Coast.              

Project Profile 2011: Fine Woody Debris Dynamics after an Ice Storm

By Jakob Lindaas

I used to walk through a forest, always looking up in wonder at the tall, sturdy trees and their vast canopies. But after this summer I have a newfound appreciation for what lies underneath these great sentries of the forest realm. Among the seasonal litterfall and the rotting remains of former protectors of peaceful succession, lay my study subjects. These are fallen soldiers of a war raged in December of 2008, between a mighty ice storm and the winter vigil kept by the mighty red oaks, their sidekick red maples, their hemlock allies, and their understory minions: beeches, yellow birches and a smattering of cherry, ash and other species.

These branches and sticks that fell are called Fine Woody Debris (FWD) -- greater than 2cm in diameter but less than 7.5cm. They play an important role in the detritus part of the carbon cycle, which, along with above- and below-ground biomass and soils, form the three main reservoirs in the temperate forest C cycle. The Environmental Monitoring Site’s Eddy Flux Tower here at the Harvard Forest has been monitoring this cycle for over 20 years now, and biometry measurements in 33 plots surrounding the tower help separate and quantify the different C pools.

As the ice storm’s impact on this carbon exchange began to be assessed, measuring and quantifying the amount of FWD that fell to the forest floor was very important. The summer after the ice storm, my mentor, Leland Werden, and two REU students measured the FWD in all 33 plots and tagged them with pink tagging. This summer we investigated how much the FWD has decayed in two years.

Over a 10-week period, we re-found as many pieces as possible and re-measured their length, diameter, decay class, and other factors that influence decay rates. This process went much slower than it did 2 years ago, and we ended up confidently finding most of the pieces in only 8 of the 12 plots we re-measured.

After organizing the data to make sure we were comparing the exact same pieces, we found that overall volumes only experienced slight changes. So we measured the densities of the 6 main species and the 3 decay classes we found. We found significant changes in density, which translate to a C flux out of the FWD. However, due to the high spatial variability of the FWD among the plots, we could not confidently quantify the change in the Ice Storm FWD C pool. We were able to conclude that a disturbance event such as an ice storm to a temperate forest can result in a rapid initial increase in the C flux out of the FWD C pool.

Wednesday, August 3, 2011

Project Profile: Paleoecology Lab

By Lindsay Day

This summer, I researched and contributed to the reconstruction of past ecosystems by working in the Paleoecology lab. Our main field research experience involved a lake-coring trip to Martha’s Vineyard. My mentor Wyatt, lab manager Elaine Doughty, Director of Harvard Forest David Foster and I loaded up the big green van with canoes and coring equipment and took the trip out to the Vineyard. Lake coring involves attaching a wooden board to two canoes and loading all sorts of tubes and poles into the constructed raft. The four of us rode the raft out to the deepest point in the lake and proceeded to set up tubing for extraction of lake sediment. This process can be long and arduous, depending on how deep the lake sediment is. We took cores until we hit sand that we could not push through. Over our four-day trip to the Vineyard, we got to see much of the beautiful island, we cored five ponds on the island, and brought back a few meters of cores from each. After we collect the cores, we bring them back to the lab and cut them up into one centimeter sections according to their depth in the sediment and use them from a variety of research. While this involved a good bit of heavy lifting, the experience was fun, unforgettable, and very rewarding as I got to see exactly how the Paleoecology lab collects its data for uncovering history. From the lake sediments, we can identify the age of the sediment by sending it out to be tested and dated. However, right in the Paleo lab, we do tests to reconstruct periods of drought by measuring organic material, identify times when fire occurred through counting charcoal, and process pollen to discover what plants were growing in the area around the lakes. I got to do some of these tests over the summer and contribute to the large amount of data collected by the Paleo lab for revealing the history of New England vegetation. The data from the past is used to help us understand current questions on our changing world. The experience was invaluable and I hope to explore the area of paleoecology more after this summer.

Project Profile: "Warm Ants"

By Natashia, Michael, and Kevin

The Warm Ants team is interested in examining the effects of climate change on ecosystem services, species interactions, and biodiversity. We are continuing monitoring of the open top heated chambers at the long term Warm Ants plot through monthly pitfall trapping, winkler sampling, vegetation surveys, and artificial nest investigation. Check out a video we made describing the experimental design of the heated chambers!

Michael is studying the effects of climate change on ant-aphid mutualisms. He wants to see how species interactions will change under artificially warmed conditions. The Warm Ants team dug up and transplanted 90 aspen trees and collected tens of thousands of aphids to get this project off the ground. Now that the set-up has all been completed, daily work of the Warm Aphids project includes counting aphids, observing ants, and measuring plant stress on the aspen trees.
Kevin is researching ant competition and its effect on biodiversity and community composition. We used tuna as a bait to quantify the level of competition in open and forest habitats to examine if it is a potential driver of local biodiversity. We also hand sampled plots to examine nest density. Fun activities of this project included overnight camping for nest colony sampling, snacking on lichen and wild blueberries during fieldwork, and travels to Plymouth, MA.

Natashia has designed a microcosm experiment testing the effects of warming on various ecosystem services provided by ants. Team Warm Ants spent early mornings digging for ant colonies in Montague, MA. For more fun details about daily summer life at Harvard Forest, check out her blog.

Group Project Profile: Climate change impacts on phenology and ecosystem processes of Northeastern forests

By Bridget, Libby, Lakeitha, Rachel, and Isaac

Phenology is the study of changes in organisms due to the seasonal cycle. Phenological shifts in forest and other ecosystems, due to climate change, could have important impacts on carbon and nutrient cycling. Therefore, it is important to find easy and accurate ways of tracking phenology in numerous ecosystems over an extended period of time. The Harvard Forest has multiple digital cameras set up to take photos of the canopy. These cameras are part of a larger network of digital cameras known as the Phenocam network. Images from this network are used to evaluate changes in phenology based on how green the canopy is. Our research team has spent the summer evaluating different methods for tracking phenological changes.

Lakeitha, Rachel and Isaac spend most of their time working on data analysis. The task began with the data management of 400 GB of phenocam data from 130 sites across the country. The images were filtered, organized and data was collected on each site. Next the data was analyzed to create a time series for each year of data. The phenological models were then checked against visual inspection to see if they hold up for different ecosystems. Lastly, the webcam data was compared to the MODIS satellite data, to determine the strengths and weaknesses of the Phenocam network.

Libby’s project aims to test various methods for calculating Leaf Area Index and tracking the changes in photosynthetic capability of the trees over the course of the season. She is primarily investigating the use of photography to study this. Previous research has shown that LAI can be calculated by taking upwards looking photographs of tree canopies using a fisheye lens and correcting for leaf angle based on the theory that when combined, the angles of the leaves will roughly correlate to a full sphere. This method also only allowed for photographs to be taken in certain light conditions, so usually at dawn or dusk. This summer Libby is trialling a less restrictive sampling procedure using digital cover photography. Once a week she goes out to 33 plots in the footprint of the EMS tower and takes 3 images of the canopy. These photographs are in RAW format so that exposure can be manipulated later on the computer. These files are then analyzed to calculate LAI. Libby also takes horizontal photographs of the leaves of three tree species- yellow birch, red oak and red maple- from the walk up tower to derive leaf inclination angle distribution functions which can be used in conjunction with the canopy photos to derive a more accurate estimation of LAI. This data set is then compared with LAI-2000 measurements and canopy greenness from the EMS tower webcam image archives.

Bridget has spent her summer taking leaf level measurements to use in later parameter derivation for phenological models and to compare the seasonal trends in leaf physiology with the Phenocam images. The goal is to understand how physiological changes within the leaf correlate to the changes in greenness we are seeing with the Phenocam data. She samples leaves from the canopy walk-up tower and then measures the leaf spectral properties, fluorescence, leaf area and mass in order to track changes of the properties over time. She also spends a lot of time up in the canopy sitting in Bucky, the forest cherry picker, taking gas exchange measurements in order to understand the how photosynthetic rates of different tree species vary throughout the season.