Friday, June 28, 2013

This Website has Moved

This site's content has been transferred here: http://harvardforest.fas.harvard.edu/blog

Check out new blogs there as well!

Tuesday, June 11, 2013

Snapshots from a forest: Comparing 1937, 1992 and 2013

By: Hannah Wiesner

Laying out two tape measures to create a 22.5m x 22.5m square, my first field exercise this summer took place not within the Harvard Forest’s 3,500 acres, but instead on the lawn behind a residential cabin. We were learning to use a compass to place a stake at the NE, NW, SE and SW corners of the square, which is much easier to do in a yard where the only obstacles between you and your partner are inch-long blades of grass and not trees several meters in height. Creating exact plots is necessary for our project because we aim to recreate the plots that were set-up in 1937 and 1992 in the exact same locations. This will enable us to compare our data with the data collected in those years as part of a long-term study in order to see how much carbon is stored in the forest.

Trees take in carbon from the atmosphere, which gets stored in their roots, trunks, branches and leaves. I’m working in a group with four students and five mentors to see how much carbon is being stored. We’re also collecting soil samples, tree cores and data on more specific aspects of plant biology in order to gain a more complete picture of the forest as it changes, which you’ll learn more about in future blog posts.

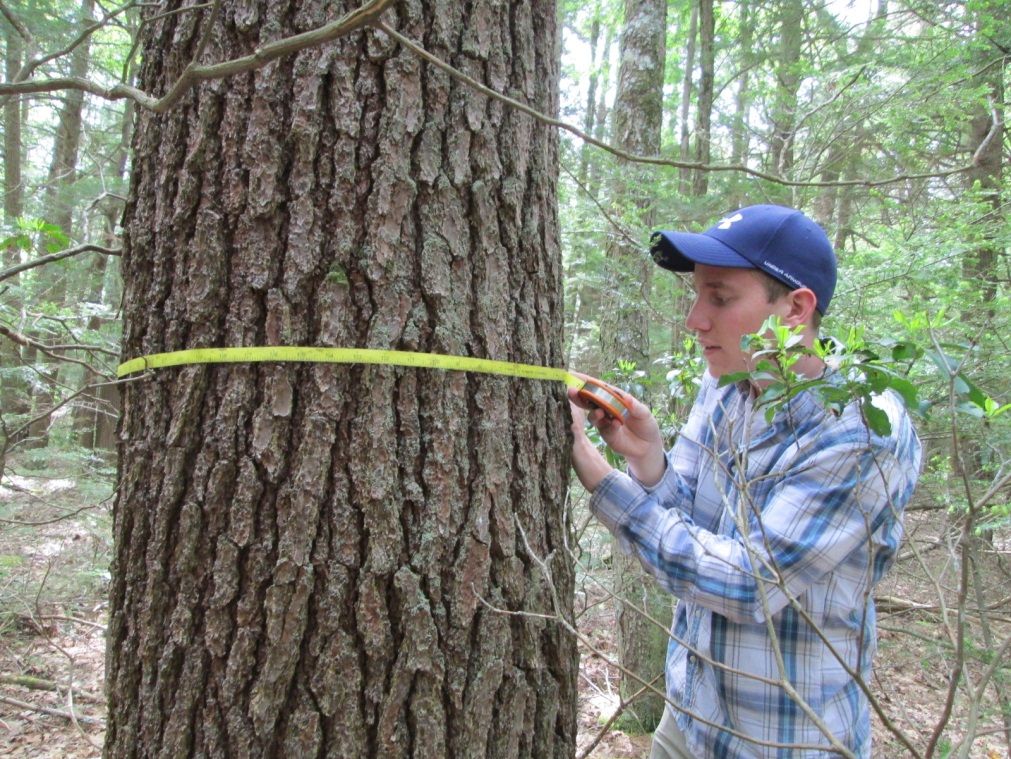
Pat O'Hara measures this tree's DBH, or diameter at breast height.
Our group is lucky in that we get to spend loads of time outside. It rained during most of our first week here, but we were able to squeeze in some field work between storms and even when the temperature gets hot, the shade of the forest keeps us much cooler. Finding our plots is an important first step, which means we get to explore large portions of the Harvard Forest, both hiking along the paths and bushwhacking off the trail. We carry our equipment, which includes a GPS unit and other high tech gear such as Dunkin’ Donuts iced coffee straws (for tree cores) to the study sites with us.

Within each plot, we hug each tree to measure its diameter. That information will eventually be translated into the amount of carbon stored using equations specific to different tree species. One of my favorite parts of the project has been learning how to differentiate between hemlock, white pine, striped maple, red oak and the numerous other species we encounter. We also mark down whether each tree is living or dead, which is less obvious than I assumed, but that I expect will become easier as we finish more plots (2 down, at least 98 to go).

Not only does the forest provide space for numerous research projects, but it also provides boundless recreational opportunities. The trails are great for running and biking as well as wildlife spotting (we saw a beaver during a stroll along Harvard Pond, newts are abundant along the forest floor and most people are pretty keen to spot a moose) and I’m sure we’ll discover more creative uses for the forest as the summer continues on!

1. Would you rather see a movie, a parade or a magic show?

Definitely a parade, because they’re outside and you could probably find a magic show within a parade. Plus, the candy is free, unlike at the movie theatre.

2. If you could be a superhero, which special power would you choose to have?

I’d want to be able to speak every language fluently.

3. What is the first word that comes to mind when I say the word “Awesome”?

St. Bernard puppies. Just imagine all of the dogs from Beethoven.

4. What’s your favorite board game? Monopoly.

And even though it’s one of the longest games ever, I used to make “debt cards” so that my friends and I could play even longer.

HTML code generator

Monday, June 10, 2013

Boston’s a pretty hot town, or at least the trees think so

By: David Miller

Once again, I find myself wondering why this slope is so steep. The curve shows the approximate date that autumn begins relative to distance from downtown Boston, and the results are mind-boggling. I look over to my research partner, Memo Terrazas, from the University of Texas at Austin. “Fall starts half a day later per kilometer into the city… that can’t be right.” This is incredible. It appears that parts of Boston have an extra whole month of summer compared to relatively “rural” areas, like Framingham, less than 40 km from the Boston Public Garden.

Climate change is more local than you might think. Although there are massive implications across the entire planet, it can be seen within relatively small areas due to human activities. One effect is that places with high levels of human development, likes cities, tend to be warmer than nearby rural or less-developed areas. This is called an urban heat island, and it exists because of asphalt, pavement, concrete, etc. These surfaces are the skin of our urban areas, and they are exceptionally good at absorbing solar radiation. When they re-emit the energy at longer wavelengths during nighttime hours, the air temperature can be artificially increased, far beyond what it would be in a natural setting.

“Hey guys, I made a map!”

One way to study climate is through the seasonal cycles of plants and animals, a research field known as phenology. Phenology encapsulates the timing of events in biological processes because of temperature, sunlight, etc., and we are looking at how deciduous vegetation can be used to evaluate the urban heat island of Boston. Deciduous plants, like oaks and maples, follow an expected seasonal trend: they lose their leaves in autumn, and regain them with alacrity in spring. We can define the change of seasons by these phenological events, and the specific dates that spring and autumn begin can vary widely from location to location.

Average end of season (EOS) by day of year (DOY) for deciduous pixels, showing range of variability in the data. For reference, day of year 290 = Oct 17th. This scene is centered on Boston and the maximum radius is approximately 40 km, which is roughly I-495.

In order to find this diversity in seasonality, we have turned to using satellite data in order to see broad trends across the landscape. We are using two satellite sensor systems, MODIS (Memo) and Landsat (myself), both launched by NASA. These are essentially big cameras that are able to distinguish between different wavelengths of light. The MODIS sensor is housed on two different satellites, Terra and Aqua, and although it is able to obtain data on a near-daily basis, it has to forgo spatial resolution as a consequence, dividing the data into blocks, or pixels, that are about 500 m on a side. Landsat on the other hand, while it only circles around to the same location on the planet every 16 days, has pixels that are 30 m on a side. As a result, Landsat is much better for finding subtle variations in surface features. This is the key reasoning behind my mentor’s (Eli Melaas) approach. There are few trees in the concrete jungle, and so performing the high-wire act of finding purely deciduous pixels in downtown Boston, for example, can be notoriously tricky to do right.

But we can find these pixels by looking to the enhanced vegetation index, or EVI, which essentially determines how “vegetative” an area is based on the reflective properties of plants. A high EVI corresponds to dense vegetation, and vice versa. By combining image data, we have found the EVI for every pixel in every usable image that contains Boston. Then we can plot them by day of year, and with a best-fit curve can find the average dates of spring and autumn for every deciduous pixel in the scene. Only pixels that have a strong enough change in EVI throughout the year, going from bare in winter to fully leafed-out in summer, can we call deciduous. With these average dates in mind, we can visualize the urban heat island as it impacts deciduous plants.

Spring starts earlier in Boston (defined as zero on the x-axis)…
…autumn starts later!

Our current process is based on distance from the Boston Public Garden, but we will soon be including temperature data as well. The whole goal is to better understand how seasonality, as determined by the natural world, is affected by human activities, and the true immensity of our impacts may be greater than we ever thought.

HTML code generator

Friday, June 7, 2013

What Do We Care About More? Biodiversity or Old Trees

By: James Leitner

I hear my alarm go off, 3:45am uhhhh. Time to get up and check the traps to see if we caught any rodents. My research project is seeing how the declines of the hemlock trees are affecting the amount of small rodent species like mice, shrews, voles, and flying squirrels. And yes, they are all adorable.

Hemlock trees can grow more than one hundred feet tall and can live for hundreds of years. They provide homes for a lot of animals and insects, and are also a good food source for some animals that eat the leaves. Since they are so tall, they provide a lot of shade and make the area around them very cool.
-->
A huge hemlock tree.

Here is a picture of a few big, old hemlock trees. As you can see, even though it is bright and sunny, the area is covered in shade, creating a very cool climate underneath these trees. Hemlock trees stretch all the way down the northeast coast of the United States, down the Appalachian mountains and up through Canada to Ontario.

Since the 1980s, two main problems have been destroying these beautiful trees. First, the trees are being cut down to be used for timber. This timber can be used to make picture frames, help with roof support, or it can also be used to make boxes and crates. They are being logged at a very fast rate. The other way the hemlock trees are decreasing is because of an insect called the Hemlock Woolly Adelgid.
Hemlock Woolly Adelgid

Those little white dots are produced by the Woolly Adelgid. The Adelgids show up on Hemlocks regardless of age and can kill the tree within 5-15 years. When these little white dots show on these trees, it is only a matter of time until the Hemlock cannot support its tall body, and falls.

My experiment is seeing how the loss of hemlock trees caused by the Woolly Adelgid and by logging is affecting small rodent populations. We work in 4 different square areas that resemble different types of Hemlock conditions: logging (logging), destroyed trees from the Adelgid (girdled), long term effects of hemlock loss (hardwood), and an area of hemlock unharmed (hemlock control). Most rodents are nocturnal and come out to find food at night, so we had to set traps at night to see what different types of rodents we could find. Don’t worry, the traps do not hurt the animals. All we do is record what type of rodent it is, how much it weighs, its maturity, if we already previously caught it, and we also take saliva samples. What we have noticed is that there is a big increase in rodent species in the girdled plots and in the hardwood plots as well. This is interesting because biodiversity increases when there are fewer hemlock trees. So it poses the question, do people care about biodiversity or old trees?

Wednesday, June 5, 2013

Time Lapse Photography Goes Underground

By: Arline Gould

We rarely give much thought to what goes on beneath our feet. Even those of us who enjoy outdoor activities spend considerable amounts of money on shielding our soles from the earth upon which we walk. So much of what we know and experience pertains only to aboveground settings. Plants, on the other hand, derive much of their livelihood from the soil on which most of us are content merely to tread.

This summer, I have the opportunity to alter common conceptions of forests, specifically the temperate forests I have grown up in and learned from throughout my entire life. With my mentor, Rose Abramoff, and fellow intern, Johanna Recalde, I will be exploring the growth and decay of fine roots in the Harvard Forest. This is important because fine roots are a significant component of the cycles which makes forest soils a major carbon sink. If we can gain a better understanding of root life cycles and thus belowground carbon sequestration, we can better predict the effects on climate change on those cycles. We do this using a cylindrical camera called the Minirhizotron, which I embarrassingly proposed slinging over my back while riding a bicycle during our orientation week (if you laid eyes upon the size or price tag of this piece of equipment, you would realize just how ridiculous of a proposition that was). The camera fits perfectly into about 60 tubes installed throughout the forest, including 24 in the nitrogen addition/soil warming plots.

Minirhizotron

Here are close-ups of our non-waterproof Minirhizotron and our indispensable Swiffer, used for periodically cleaning condensation out of the tubes while taking photographs.:

Swiffer

After we capture images with the minirhizotron, we process them in a program called Rootfly, where we can trace the roots and see when they are growing or dying over time. During orientation week, Johanna and I were also introduced to Rose’s root boxes and their [uninvited] inhabitants.

The little guy was curious.

These boxes have 2 gridded panels so that we can measure root growth through photography, as well as flaps from which we can take samples of root tissues to gain an even better understanding of what is going on underground. This will be particularly useful during my studies of roots and their symbiotic fungi.

In other news, getting acclimated to the life at the Harvard Forest has been relaxing, stimulating, and motivationally inspiring all at once. The fresh air, surrounding wildlife and available knowledge pool give me no doubts that this summer will be one of great health and intellectual development. The delicious food doesn’t hurt either. Some highlights so far include my research work (of course), our Memorial Day barbeque, our workshop on “Talking Ecology with the Public” with Clarisse Hart (evidence of which you will have already inferred through how incredibly entertaining this blog post is), and climbing a tower which tested the magnitude of my fear of heights. Here is a photo of Channing and me at the top of the tower. I promise I was excited to be in the Hemlock canopy with an incredible view of the forest—I am not great at being the subject of photos.

Oh yeah, this tower is for doing really cool science-y stuff like measuring CO2.

Finally I will leave you, dear reader, with a photo from our Memorial Day Barbeque that symbolizes the warmth and zest stirring in my brain and tummy after a week of living and working at the Harvard Forest.

Our Memorial Day Barbeque.
HTML code generator

Tuesday, June 4, 2013

Trees on Fire

By: Dmitri Ilushin

Kenya? Been there. Japan? Seen that. Michigan highway I-96? Saw that last week. The best part is that I can do all this without leaving the comfort of my computer.

My research at the forest involves trying to extract the day that leaves come out and when they fall off. The thing is, we don’t really notice when the world gets just a bit hotter each year ourselves, but trees and other types of plants react pronouncedly to any subtle changes in average temperatures. I study these reactions by looking at pictures of trees over time from cameras located all around the world. In doing so, I try to grab a signal from these photos that can tell me what the rhythm of the seasons is like. This is a new technique that I am trying to understand how accurately this describes what’s going on around us. One of the major issues that I have to try to address comes from the lack of control from the cameras. These cameras are all controlled by other people, free to do whatever they want to with the cameras; sometimes they rotate their view, other times they stop streaming photos altogether. With all these different cameras and their intricacies, my work this summer will involve creating processes to filter out relevant information from the 60,000,000+ photos and then smooth out the resulting data to find out just when spring and fall happen all around the world. By getting a better idea of just what happens as the earth continues to heat up, we can hopefully get a better idea of how to best keep our earth sustainable for life indefinitely.

A tree in all four seasons.

You might be thinking to yourself, why is this guy at a biological summer program? It sounds like he just works with computers and pictures. Well, I actually am an applied mathematics/computer science major at school; it just so happens that even biologists need computer shamans, those select people that have an affinity for communicating with the spirits of technology. Really, I see myself as a toolkit-other people employ my skills to suit their project, and with a little thought and elbow grease, I can get anything done. Really, many fields are more cross-disciplinary than we think, and applying myself in an unfamiliar area opens up a new way of thinking.

Fisher house is one of the two residences. “It's nice” is an understatement."

The living arrangements here are incredible. We stay in two cottages that are right at the entrance to the Harvard forest. Think about the one in Snow White and the Seven Dwarves, except instead of Snow White we have our proctor, Monica, and instead of the seven dwarves, there are nine summer interns.

Yeah, I'm the goof who messed up on crossing his arms.

Just last Monday, May 20 all of us REU students met each other and began our program. I found out that this summer, I’m in a group of four people all generally working on different aspects of phenology (the study of the rhythm of the seasons). The four of us work in a cool, air conditioned room, which although unnoticed now will soon be appreciated once summer gets into full gear. We all sit in front of computers, typing away on our keyboards, studying different charts, and making the ever-so-useful box plot to show data in nice ways. We’ve been getting to know each other by chatting while work goes on. Really, though, the work is hard but we’ve all been hard at work.

A view of the Harvard Forest from the fire tower Sunday morning.

Sunday morning, May 26 a group of five of us researchers rode up to the fire tower. Riding on the dirt road was more of a struggle than I would have thought-partly because of a fallen tree and some sweet mud puddles we got to splash around in- but the view was worth it. I realize that as nice as it is to be indoors in climate control, it’s nice to take advantage of the surround area once in a while. Plus, living in 60 degree weather sure beats the sweltering heat my parents talk about.

What's your favorite board game?

Not to go into too much detail, but I'd have to say that the game Primordial Soup would be my number one, followed closely by bughouse. Primordial Soup is a game where you have amoeba that have genetic mutations and advance on the board based on the number of mutations and amoeba that are in your control. It's really cool in that you have so many different ways to play your character; you could be aggressive and attack others, or you could try to live as meekly as possible.

If you could be a superhero with a special power, what would it be?

If I could be a superhero with a special ability, I would choose to have the power to pinch to zoom objects in real life, with the fatal flaw that I am often not perfect in my target for pinch to zoom. It would create funny situations which would be self-created. I'd probably be called "The SuperSizer" or something like that.

You have the choice to live with a gorilla who knows sign language or a dog who sings lullabies, which do you choose?

Given the option, I would rather pick a gorilla who knows sign language. If I'm living with him, we're probably cool enough to where he would go places and we would be great friends. Who wouldn't want a gorilla? As for the singing dog, I don't know how well the dog would be at singing, or whether it could even sing in English. With the gorilla, it would still be really fun to try communicating with him.

HTML code generator