By: David Miller
Once again, I find myself wondering why this slope is so steep. The curve shows the approximate date that autumn begins relative to distance from downtown Boston, and the results are mind-boggling. I look over to my research partner, Memo Terrazas, from the University of Texas at Austin. “Fall starts half a day later per kilometer into the city… that can’t be right.” This is incredible. It appears that parts of Boston have an extra whole month of summer compared to relatively “rural” areas, like Framingham, less than 40 km from the Boston Public Garden.
Climate change is more local than you might think. Although there are massive implications across the entire planet, it can be seen within relatively small areas due to human activities. One effect is that places with high levels of human development, likes cities, tend to be warmer than nearby rural or less-developed areas. This is called an urban heat island, and it exists because of asphalt, pavement, concrete, etc. These surfaces are the skin of our urban areas, and they are exceptionally good at absorbing solar radiation. When they re-emit the energy at longer wavelengths during nighttime hours, the air temperature can be artificially increased, far beyond what it would be in a natural setting.
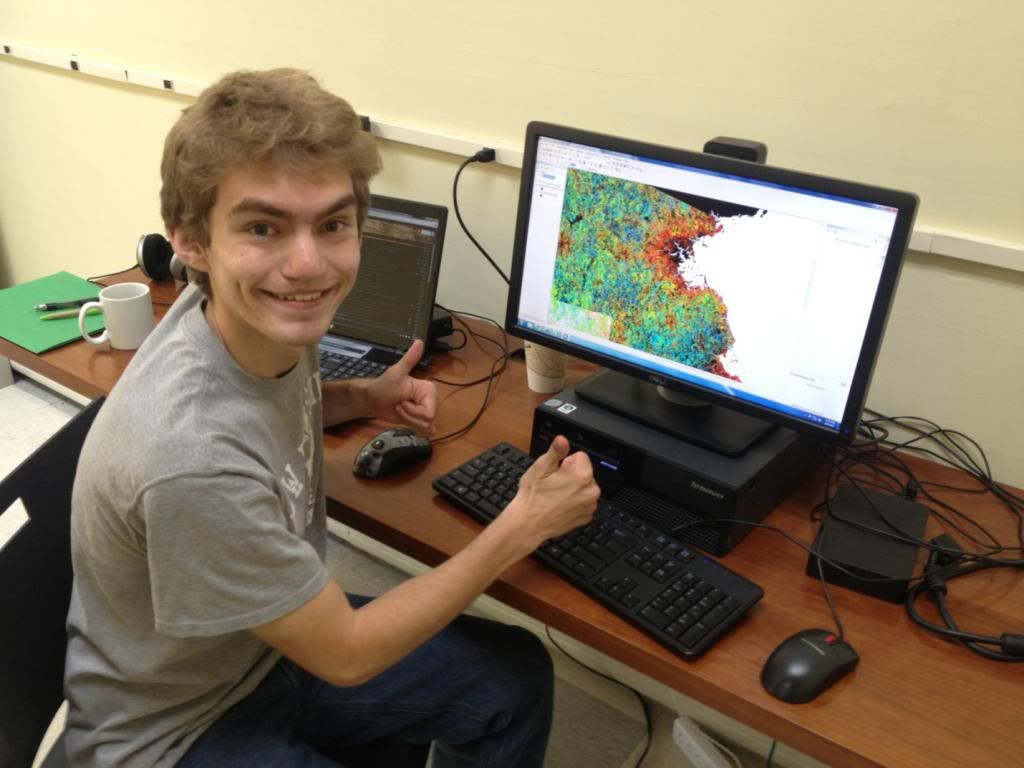
“Hey guys, I made a map!”

One way to study climate is through the seasonal cycles of plants and animals, a research field known as phenology. Phenology encapsulates the timing of events in biological processes because of temperature, sunlight, etc., and we are looking at how deciduous vegetation can be used to evaluate the urban heat island of Boston. Deciduous plants, like oaks and maples, follow an expected seasonal trend: they lose their leaves in autumn, and regain them with alacrity in spring. We can define the change of seasons by these phenological events, and the specific dates that spring and autumn begin can vary widely from location to location.
