
Near Remote Sensing to Track Changes in Phenology in Forests, Team Harvard
By Dmitri Ilushin, Sascha Perry, and Hannah Skolnik

Team Harvard is comprised of Dmitri Ilushin of Harvard University; Sascha Perry, Lincoln University in Missouri; and Hannah Skolnik of Columbia University. We are under the direction of the Richardson Lab within the Department of Organismic & Evolutionary Biology at Harvard University. Phenology is the study of life cycles in various organisms. Specifically, we’ve been looking at tree phenology, tracking spring leaf out (when the trees start growing leaves after lying dormant all winter) and autumn senescence (when the leaves begin to change colors and drop from the trees). This summer, we have had the opportunity to challenge the question “Can webcam imagery track phenological changes?” Believe it or not, we can do just that! By looking at over 1800 different webcams with about 60 million images from all over the world, we were able to track the cameras' stability and views of vegetation. With this information, we’ve been able to track Green Chromatic Coordinate (GCC), a measure of the percentage of greenness of an area of an image. The GCC graphs yield quantitative information to track the changes of the seasons.
Below is a map of all the sites that are on the AMOS archive.
Great sites are green. Good Sites are yellow. Unusable sites are red.

In order to parse through such a large data set, we had to come up with a protocol. Firstly, we conducted a preliminary, visual inspection of the 1879 sites with known locations. We looked through a subset of a site's images and noted FOV (field of view) shifts, when the camera moved noticeably. Based on the number of FOV shifts, we marked the sites either as stable (no movement), constant (consistently changing), or poor (too many shifts to use the site). Of the stable locations, we looked through each photo and found the exact times when FOV shifts occurred. We then made ROIs (Regions Of Interest), or selections of certain pixels of the image, that covered trees, shrubs, grass, or crops. Finally, a program was run that takes all of this information, calculates the GCC from the ROIs we made, and makes a time series (GCC graph) for each year. We decided to focus on creating GCC graphs for a vertical gradient along the Atlantic coast of the United States as well as two horizontal gradients in the US, one in the north, and one in the south.
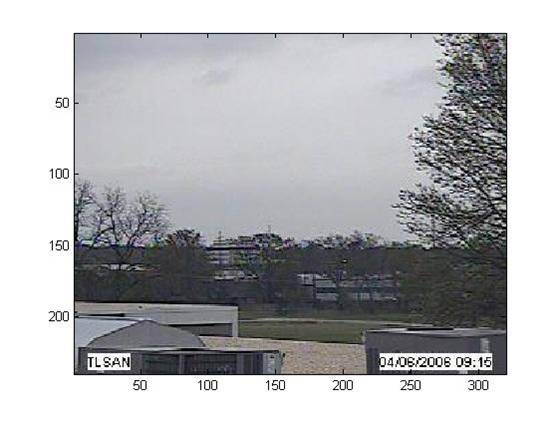
A sample vegetated site:
The ROIs made for this field of view:

The resulting GCC graph calculated for one year:

Studying phenology has been a blast. We’ve been able to study the immediate effects of recent climate phenomena. By calculating Green Chromatic Coordinate (GCC) curves and studying them across the United States, we have been able to see how these warming patterns have been affecting growing seasons across the country. What we have been doing has been on a smaller scale than satellite imagery so we can compare patterns even between species. However, by using the Archive of Many Outdoor Scenes (AMOS), we have huge spatial coverage, which allows us to compare how a certain species of tree is growing on the east coast versus the west coast, for example. Thus, webcam imagery represents a happy medium of scale. We can study the small scale and compare it to almost all other biomes and the same biome in different parts of the world.
We got to see some incredible places including the North Pole, Kenya and Japan in addition to the Continental United States. Here is a representative photo from Kenya of a water buffalo at a watering hole, one of our more interesting sites:

MODIS Satellite Imagery as Applied to Phenological Assessment, Team BU
By Erin Frick and Jose Luis Rugelio

Observations of vegetation phenology can be collected not only from ground-level field studies but also space borne remote sensing instruments. In particular, satellite images may be used to assess vegetative phenophase transition dates such as spring onset, maximum vegetation cover and senescence across regional scales. One approach to such assessment entails analysis of data from the MODIS (Moderate Resolution Imaging Spectroradiometer) instrument. MODIS provides measurements of light reflectance that can be analyzed to estimate phenophase transition dates with respect to variation in land cover type. Despite the utility of the MODIS data, atmospheric factors including cloud coverage and presence of aerosols as well as land cover features such as snow and ice, can distort data received by satellites, rendering this information unreliable. Differences between the outputs of various MODIS satellite products are also a result of factors including the timing of the satellites’ orbits, intervals between image collection and the way in which the reflectance values are processed. These anomalies result in each product yielding a varying quantity of valid data. A goal in remote sensing research is determining which MODIS product contains the greatest amount of high quality information to be used to accurately calculate phenophase transition dates. In order to assess the differences between and overall utility of these MODIS products, we have created a variety of plots and maps which address: NDVI (normalized difference vegetation index), EVI (enhanced vegetation index), date of spring onset, land cover variation, differing levels of quality control, comparisons across time series within and between years, and quantity/location of ‘good’ data— all of which illuminate the unique strengths and weakness of the MODIS products.


In addition, team BU has been analyzing data from satellite imagery and the resulting picture tiles. Pixel values can tell us the date of Green Onset and yearly trends for entire tiles, corridors, and even single pixels. We opened MODIS 12Q2 tiles in ArcMap, which is a great tool for working with these images. We then created six buffer zones around the city limits of the metropolitan area of Boston, Massachusetts (1-3km, 2-2km, 3-3km, 4-2km, 5-5km, 6-5km). Then, MatLab was used to produce graphs for 10 years (2001 - 2010) and then compared and analyzed to see what trends were present. We found that standard deviation declines as you leave the city and enter more rural and stable forests and this is apparent in all the buffer zones. The reasoning behind this is that the forest is more stable and deviates less. In contrast, as you get closer to Boston, the deviation is higher due to temperature increase. Due to the urban heat island effect, Boston greens up sooner and loses its leaves later than vegetation in rural areas. By looking at Boston, we can relate what could happen with a temperature increase of a few degrees Fahrenheit at a small scale to a global scale. Ultimately, we can use this data to better understand global warming and inform the population.

K-12 Phenology Lessons for the Phenocam Project
By Katherine Bennett
In the fall of 2011, the Ashburnham- Westminster Regional School District became the first of five schools to join Dr. Andrew Richardson’s Phenocam Network with the installation of a digital phenocam on the roof of Overlook Middle School in Ashburnham, Massachusetts. As a part of the Phenocam project, students at the K-12 level have expanded the scope of phenological monitoring that is part of the Harvard Forest Schoolyard Ecology Program protocol, Buds, Leaves, and Global Warming. In this protocol, students work with Dr. John O’Keefe to monitor buds and leaves on schoolyard trees to determine the length of the growing season. Lessons are being developed for comparing student data on budburst, color change, and leaf drop to phenocam images in Ashburnham and other locations throughout North America, GCC (Green Chromatic Coordinate) graphs extracted from the images, and satellite data. Lessons addressing map scale and Urban Heat Island effect will also be available for teachers.


No comments:
Post a Comment